
Stop expediting everything
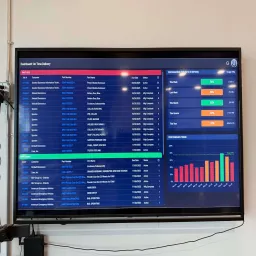
Big orange bar, small green bar: a job that's been sitting for days waiting on twenty minutes of machine time. Push that one through and it clears the floor. Customers tell us this single view is what pays for the license.
When you can see which operation is actually waiting and which is actually running, overtime and expedite money go only where they change a delivery date. Before Skody, shops expedite everything. After, it's targeted.
- ITAR-Ready
- Gov Cloud
- SOC 2
- Type II
What is forward-looking manufacturing dashboards?
Forward-looking manufacturing dashboards show the operational state of the floor — OTD risk, bottlenecks, labor pressure, material readiness — projected against the current production schedule, not just historical KPIs. Instead of reporting what happened last week, they surface what is about to go wrong this shift, with enough lead time for a planner or supervisor to intervene.
How it works
- •Live ERP/MES feed of work orders, completes, inventory, and labor.
- •Bottleneck identified from queue depth and throughput at every recompute.
- •OTD risk computed per job against the current finite-capacity schedule.
- •Labor and material gaps flagged before they hit the floor.
- •Every metric drills into the underlying jobs and constraints.
Why it matters
Most factory dashboards are rear-view: yesterday's OEE, last month's OTD. They tell you what happened, not what to do. Forward-looking dashboards give planners and supervisors 4–24 hours of warning on the jobs that are about to slip, which is the difference between an OTD ceiling at 70% and one at 90%+.
How Skody does it
Skody dashboards are wired to the live schedule, so every metric reflects the current state of the floor. Bottlenecks, labor pressure, material readiness, and OTD risk update as the schedule replans — you see the problem before the firefight starts.
The hidden cost of running blind
- Late jobs show up as customer calls, not as early warnings
- Material dollars sit idle while the floor waits on parts
- Overtime is spent on jobs that were already going to be late
- Expedite fees get spread everywhere instead of where they matter
- You learn about problems from the customer, not the dashboard
What changes when you can see it
- Spend expedite money only where it changes a delivery date
- Know which work center to clear first
- Stop paying overtime on jobs that are already lost
- Make the schedule the single source of truth
- Answer customer calls with facts, not promises
Five views that decide where money goes
Each dashboard points to a decision: push, pull, hire, buy, or wait. See where to spend attention — and where not to — before the firefight starts.
On-Time Delivery
Decide which jobs need intervention and which are on track — without a status meeting.
Every view is tied to the live schedule. See the impact of a decision before you commit labor or material to it.
Decisions are based on the current schedule, not yesterday's export.
See the decision, not just the data
Each view points to a specific decision: push, pull, hire, buy, or wait.
Clear the right bottleneck first
See which constrained work center is holding the most jobs, then decide whether to add labor, offload work, or negotiate the date.
Buy only what unblocks a job
See which jobs are actually ready to run and which are waiting on material — so purchasing and expedite spend go to the right place.
Put people where the work is
See who is overloaded, who has available capacity, and where moving one person changes the delivery picture.
Not just dashboards — a decision board for the floor.
How it works
Connected in days. Useful immediately.
Connect ERP
Share API access or exports. Skody handles the integration work.
Decisions surface automatically
OTD risk, bottlenecks, material status, and labor pressure populate as decision-ready views.
Act and refine
Your team makes decisions from the same live view, then tunes what to watch as the business changes.
Integrations
Live with ProShop · Fulcrum · JobBOSS². Also integrates with Acumatica and SYSPRO. Microsoft Dynamics 365 and QuickBooks available on request. Skody connects to any ERP. For an ERP we haven't connected yet, setup typically takes about 3 weeks after you sign.

ProShop 
JobBOSS² 
Acumatica
We handle the technical work. You just use the dashboards.
From reactive reporting to forward visibility
"We were stuck under 80% OTD. With Skody AI, we're now planning toward 100%. What really stands out is how it accounts for both machines and people — not just a static schedule, but a worker-driven plan our team actually follows."
Zachary Yeager
President, Aerospace & Defense Job Shop (11–50 employees)
<80% → ~100%
Better OTD visibility
Worker-aware
Machines + people + skills
Executable
Executable insight
See what lights up when your schedule meets reality
We'll show how Skody AI surfaces bottlenecks, labor load, material readiness, and delivery risk using a workflow relevant to your shop.
When the dashboard shows a problem, the scheduler gives you the move
Dashboards surface where execution will break. Skody AI Scheduler turns that visibility into a plan the floor can actually run.
See SchedulerQuestions? We've got answers.
OEE (Overall Equipment Effectiveness) measures manufacturing productivity by multiplying Availability × Performance × Quality.
OEE Formula:
OEE = Availability × Performance × Quality
Benchmarks:
- World-class OEE: 85%+
- Average OEE: 60%
- Poor OEE: <40%
Skody dashboards show your OEE based on the latest schedule recompute.
Skody tracks the manufacturing KPIs that drive decisions:
- OEE — Overall Equipment Effectiveness
- Utilization — Machine and labor utilization
- WIP — Work in Progress tracking
- COPQ — Cost of Poor Quality
- OTD — On-Time Delivery percentage
- Setup times — Changeover tracking
All metrics reflect the current production schedule.
Dashboards update on ERP event, on-demand recompute, or continuously where wired. You always see the state from the latest recompute, not yesterday's export.
No IT required. We handle the ERP connection — you just share read-only API credentials. Most shops are live in days, not months. No servers to manage, no software to install.